During Polygon’s most recent bullish run, MATIC breached the 20- and 50-day exponential moving averages before displaying buying superiority. Nonetheless, the $1 threshold prompted a resurgence of selling that prompted a retracement to the $0.76 baseline.
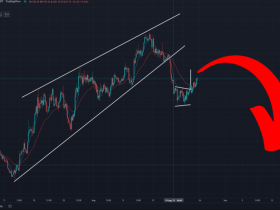
The breakdown of the ascending channel also confirmed the rising selling momentum. A sustained move below the current range of support could expose the altcoin to a short-term decline in the coming sessions. At the time of publication, MATIC was trading at $0.8058, up 2.8% from the previous trading day.
Polygon Daily Timeframe
During the most recent ascending channel oscillation, MATIC bulls breached the 3-month trend-resistance, line’s thereby converting the mark into support. In the meantime, the intersection of the 200 Exponential Moving Average and the $1 value area constituted a formidable barrier for MATIC’s expansion.
In addition, the most recent increase in selling volume indicated a massive bearish move below the short-term Exponential Moving Averages. Failure to close above the 50 Exponential Moving Average could result in a drop to $0.66-$0.67. Additionally, the altcoin may experience possible compression near $0.8 as it attempts to limit a volatile break.
A final close above $0.88 – $0.93 may trigger an increase in the 200 Exponential Moving Average. Bulls had yet to generate sufficient trading volume for a sustained close beyond the closest area of resistance.
Reasoning
The RSI (Relative Strength Index) dropped below 50, indicating a brief selling advantage. In addition, the Volume Oscillator’s higher highs and lows over the past two weeks confirmed the downward momentum of the current trend.
The MACD’s bearish crossover approached the zero line. A decline below this level would validate the bearish stance in this publication. Nevertheless, the ADX indicated a relatively weak directional bias for the altcoin.
Final Remarks
MATIC’s decline below the EMA ribbons in conjunction with increased volume suggested a bearish bias. The objectives would remain unchanged. In the meantime, a close above the short-term Exponential Moving Averages would confirm the invalidation of bearish forecasts. Investors should keep an eye on Bitcoin due to the MATIC’s 95% correlation with the leading cryptocurrency. Thus, upcoming cues from the broad market continue to be essential for Polygon’s bias.
Stay current on the latest crypto-related developments.
Credit: Dennis Diatel / shutterstock.com for editorial use


Leave a Reply